
Electrical & Resistivity Imaging
Find out about the electrical properties in the subsurface for environmental assessments to the delineation of groundwater to infrastructure earthing designs.
Applications
- Landfill investigations
- Groundwater investigations including depth to water table and aquifers
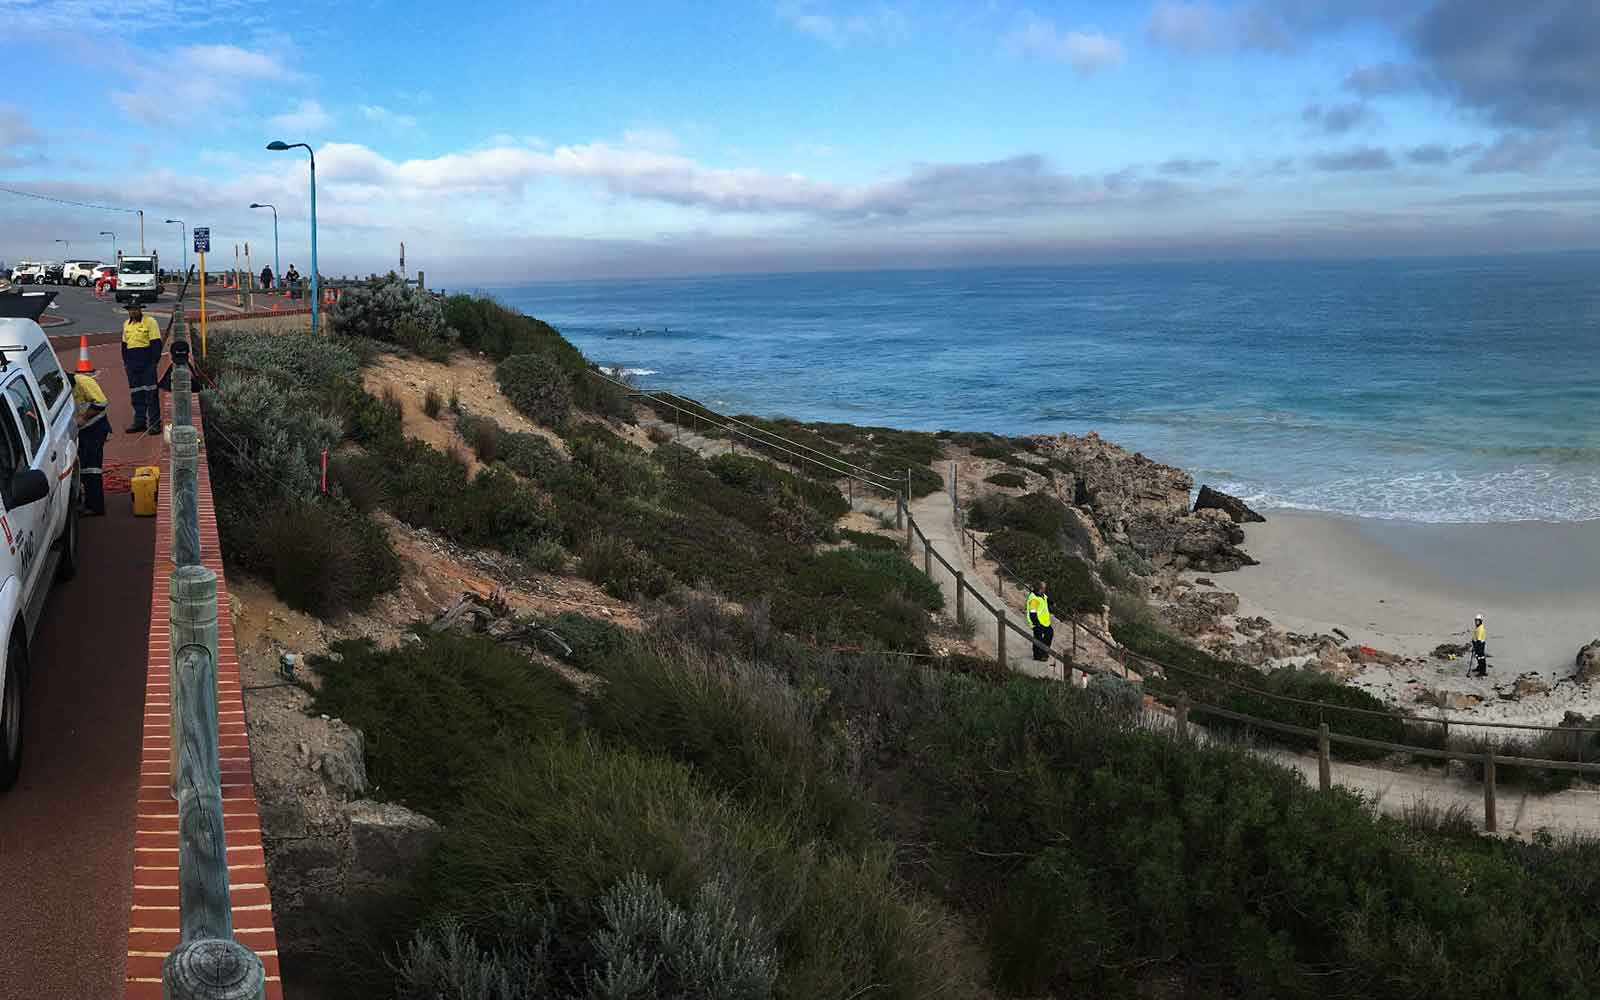
- Delineation of freshwater / saltwater interface
- Mapping and monitoring of soil salinity and inorganic contaminant plumes
- Location of paleochannels, faults / fractured zones
- Locating voids and mineshafts and cave systems
- Stratigraphic mapping including gravel and clay lenses
- Soil corrosion assessment
- Infrastructure earthing design
Method
Electrical Resistivity Imaging (ERI; or Electrical Resistivity Tomography (ERT)) is sensitive to variations in the electrical resistivity of the subsurface measured in Ohm meters (Ωm). The dominant factors affecting the bulk electric resistivity (and its inverse: conductivity) of soil or rock are:
- Material porosity and permeability
- The degree and type (including salt content) of fluid saturation
- The presence of plays with moderate to high cation exchange capacity (CEC)
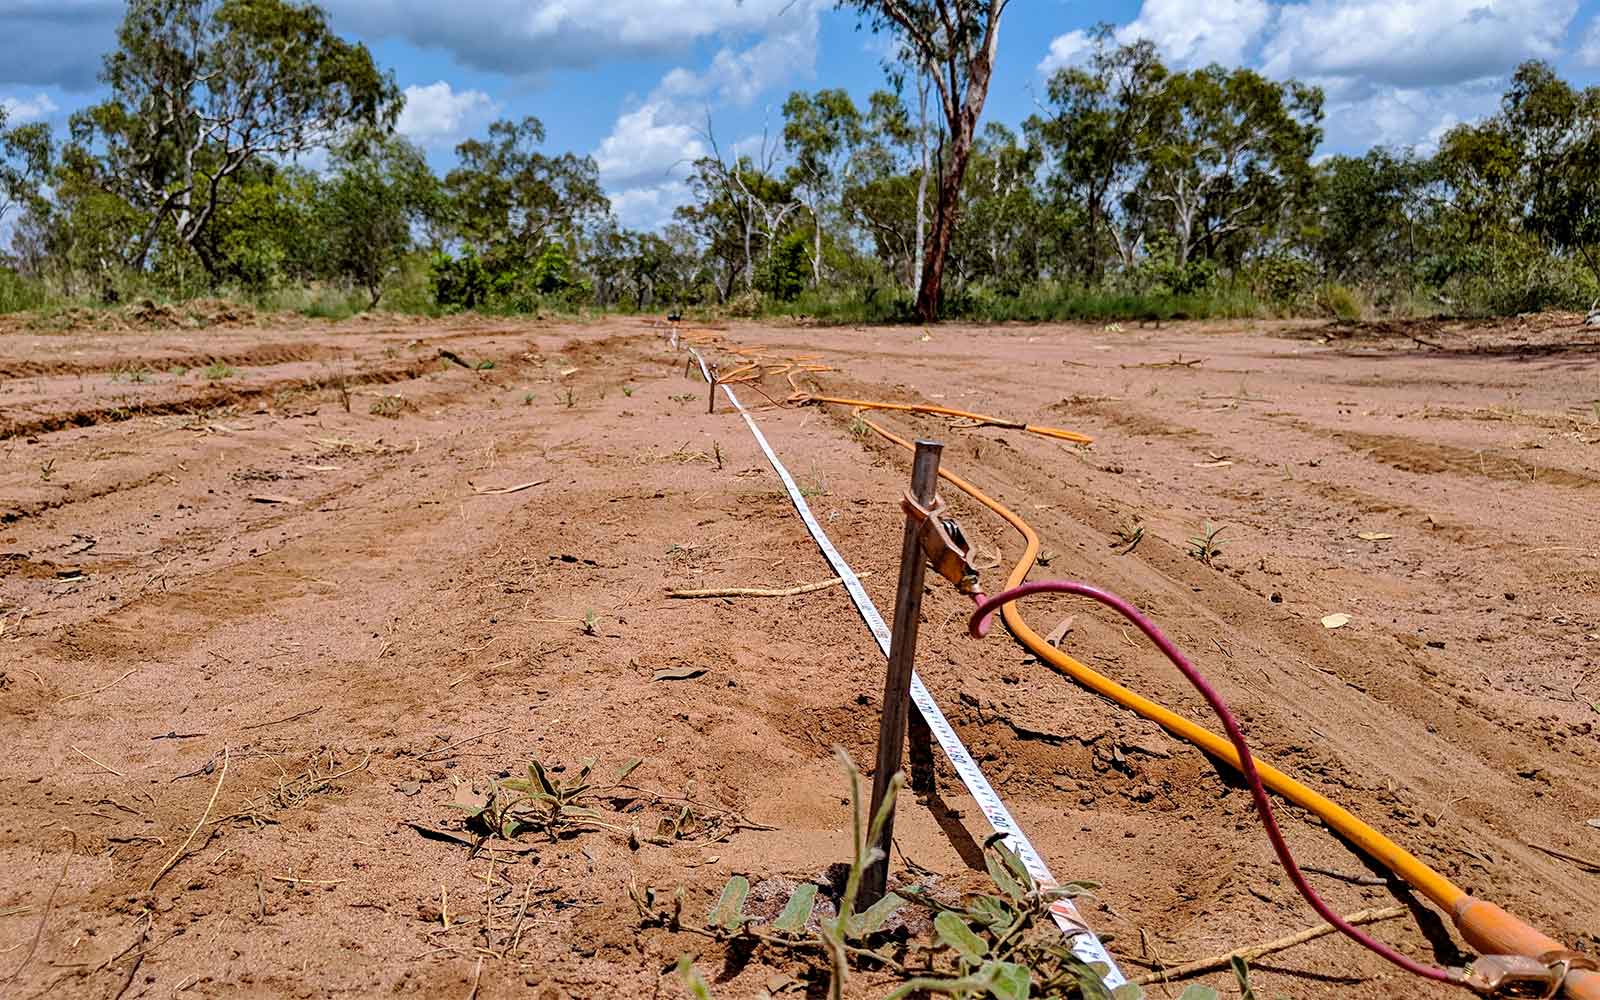
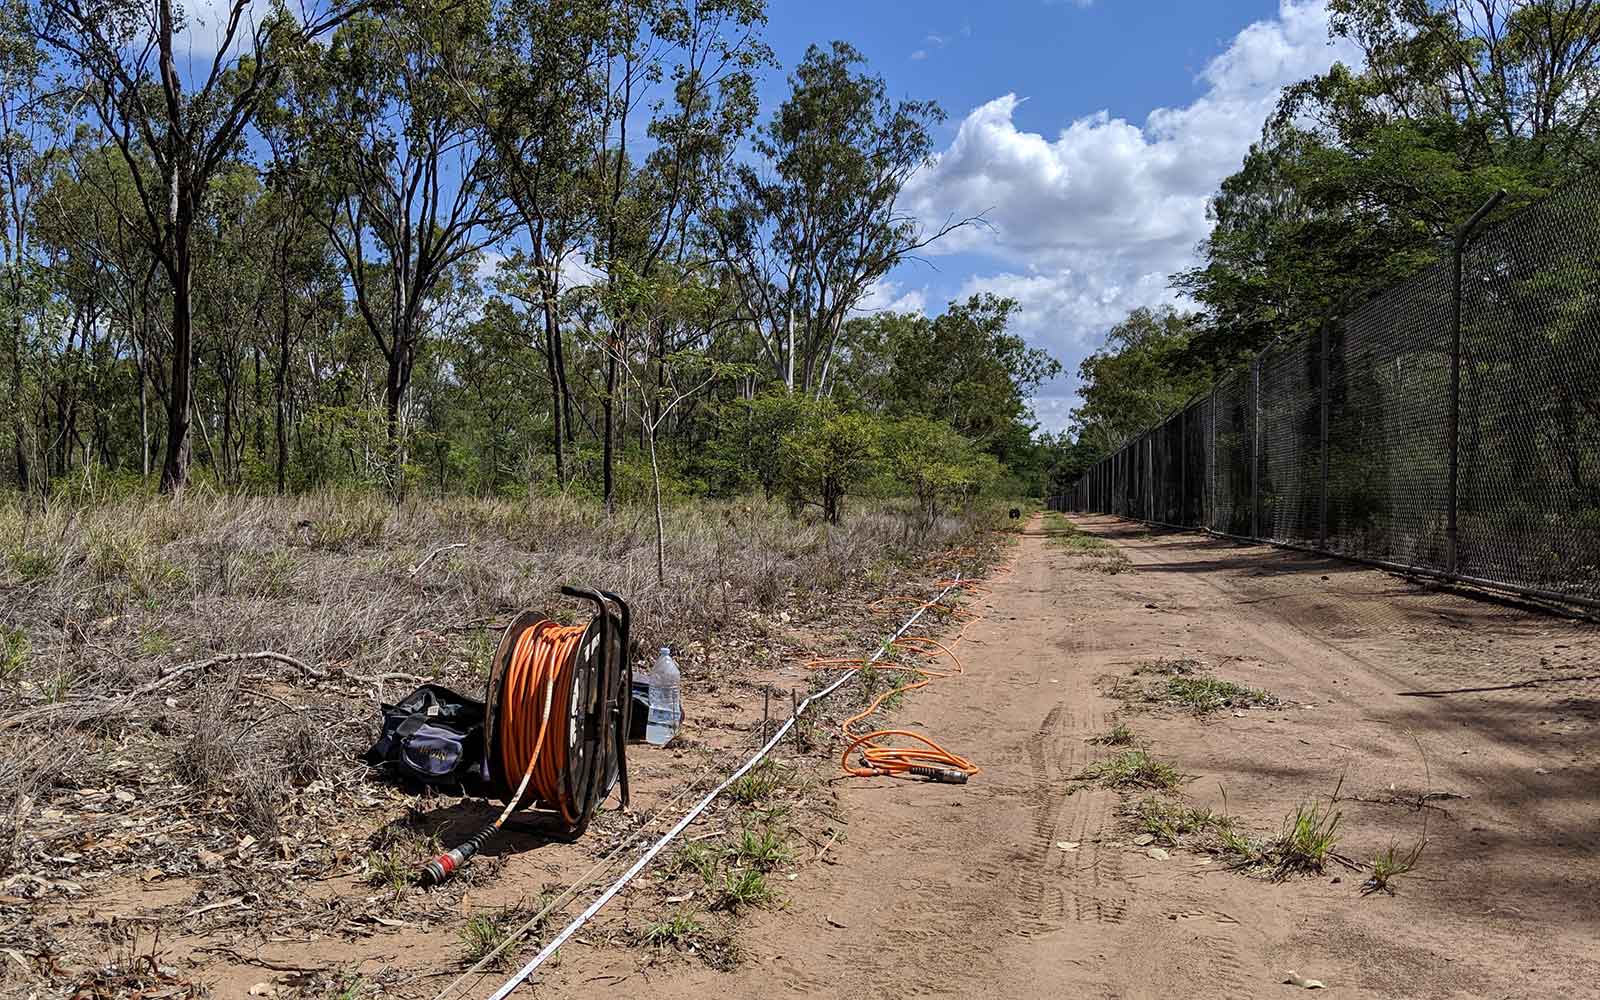
Resistivity measurements are made by inducing an electrical current into the earth through two current electrodes and measuring the resulting voltage difference at two potential electrodes. Knowing the current and voltage values, an apparent resistivity value can be calculated, the investigation depth of which is relative to the spacing between electrodes. Greater depths are achieved by increasing the electrode spacing. A number of different electrode configurations exist, each being suitable under various conditions.
Modern resistivity systems employ multiple electrodes connected to a central control unit via multiple core cables. Once the electrode array is deployed and the sequence program is set in the control unit, readings are automatically taken across a number of electrode positions.
Data Analysis & Presentation
After collection of a resistivity sequence a pseudo-section is generated showing the apparent resistivity measurements at the various depths along the profile. Quantitative resistivity readings can be calculated by running the pseudo-section through mathematical inversion algorithms resulting in 2D geo-electrical cross-section showing variations in the modelled electrical resistivity of the subsurface. The resistivity section can be interpreted to provide information on subsurface layering, linear and isolated features.
The imaging depth achievable with the ERI method is dependent on the total length of the electrode array, with larger electrode spacings resulting in greater imaging depth. The overall subsurface resistivity also affects the imaging depth with highly resistive ground tending to decrease the depth after inversion.
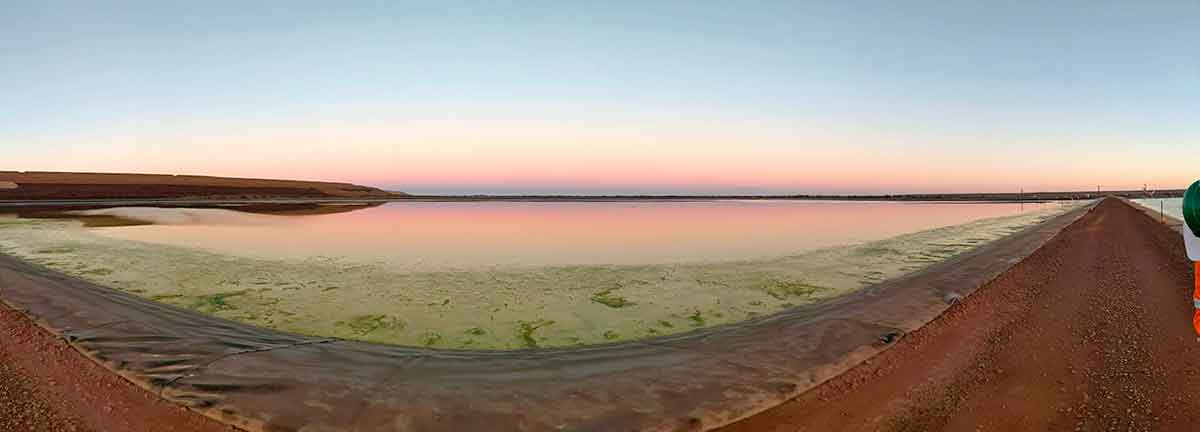
Tailings Management: Get in touch
Consider a 'Tailings First' approach for your facility and avoid creating a potentially catastrophic risk for the environment.
GBG combines industry-proven geophysical methods, geotechnical physical characterisation, hydrogeological modeling and assessment, and airborne methods for point-based data capture in assessing your requirements. Talk to us today for more information regarding this essential service for your tailings facility.
Case Studies
GBG has completed over 1000 projects since its conception with multiple stakeholders and countless clients. GBG is proud to showcase some of these projects.
Enquire Now
We look forward to discussing your project with you, please complete the form below or contact one of our offices directly.
Please note: GBG Group is compliant with the General Data Protection Regulation (GDPR). To learn more about how we collect, keep, and process your private information in compliance with GDPR, please view our privacy policy. *

Contact Us - NSW


Contact Us - WA